Data Collection
Three sites were selected to sample for prey and predator presence in northeastern Alberta between Edmonton and Fort McMurray. Due to the homogeneity of the upland boreal landscape, as well as the lack of topopgraphy, each site was considered comparable in their habitat distributions. Each site was a 5.4 x 5.4 km2 grid (total extent: 87.5 km2), containing 100 Reconyx PC900 Hyperfire cameras spaced 600 meters apart in a systematically, random set-up (Figures 3-5). Each sampling unit consisted of a camera with a motion detecting range of 30.5 m, with a night illumination range up to 18 m using a no-glow, infrared trigger. Cameras were set to take a photo every hour, on the hour, as well as a series of motion triggered photos for anything moving within the detection field of the camera from August 2nd, 2016 – November 11th, 2016.
September and October were subset from this dataset to standarize the sampling period between all three grids. The number of photos taken of white-tailed deer, black bear, coyotes, and wolves were summed across each hour of the day (1-24), as well as binned by 6 hour intervals (1-6), at each camera. White-tailed deer were summed separately from all predator species, which were summed together. The joint occurences of predator and prey were then observed at each camera station for both one and six hour intervals to estimate avoidance of predators by white-tailed deer at varying time intervals.
September and October were subset from this dataset to standarize the sampling period between all three grids. The number of photos taken of white-tailed deer, black bear, coyotes, and wolves were summed across each hour of the day (1-24), as well as binned by 6 hour intervals (1-6), at each camera. White-tailed deer were summed separately from all predator species, which were summed together. The joint occurences of predator and prey were then observed at each camera station for both one and six hour intervals to estimate avoidance of predators by white-tailed deer at varying time intervals.
Study Sites
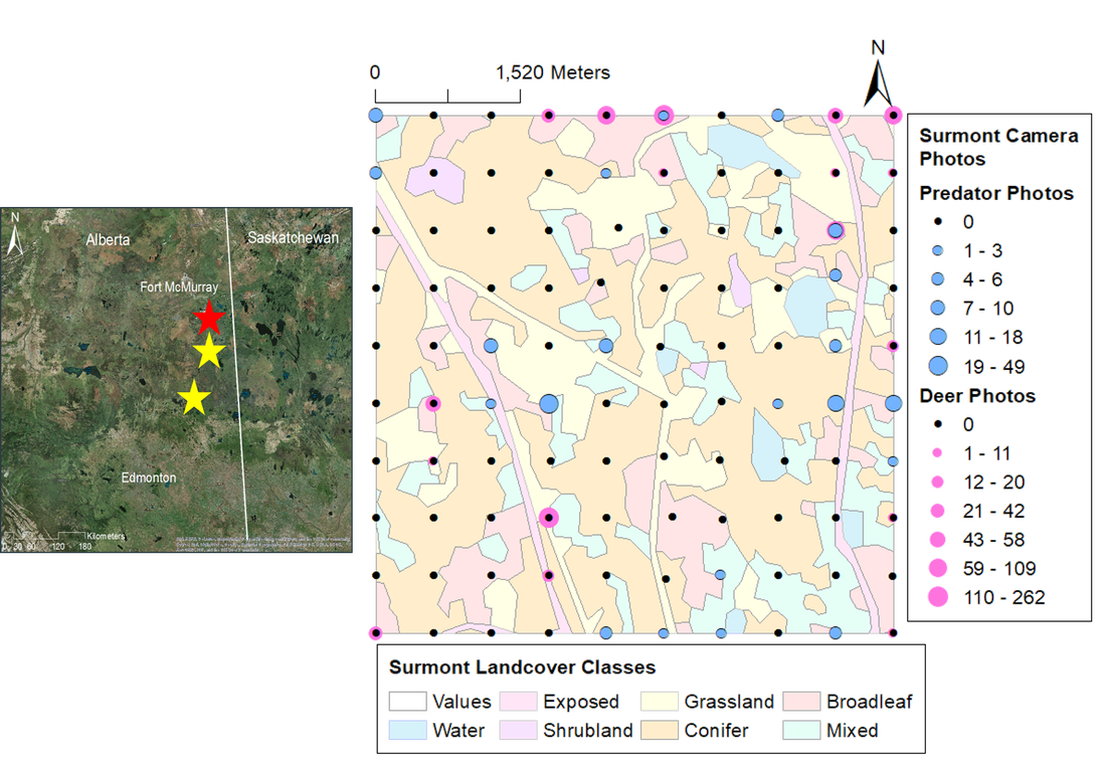
Figure 3. Northern-most camera grid located south of Anzac, Alberta. Colored polygons represent various landcover types. Blue and pink circles represent the frequency of predator and white-tailed deer photos at each camera station (black circles), respectively.
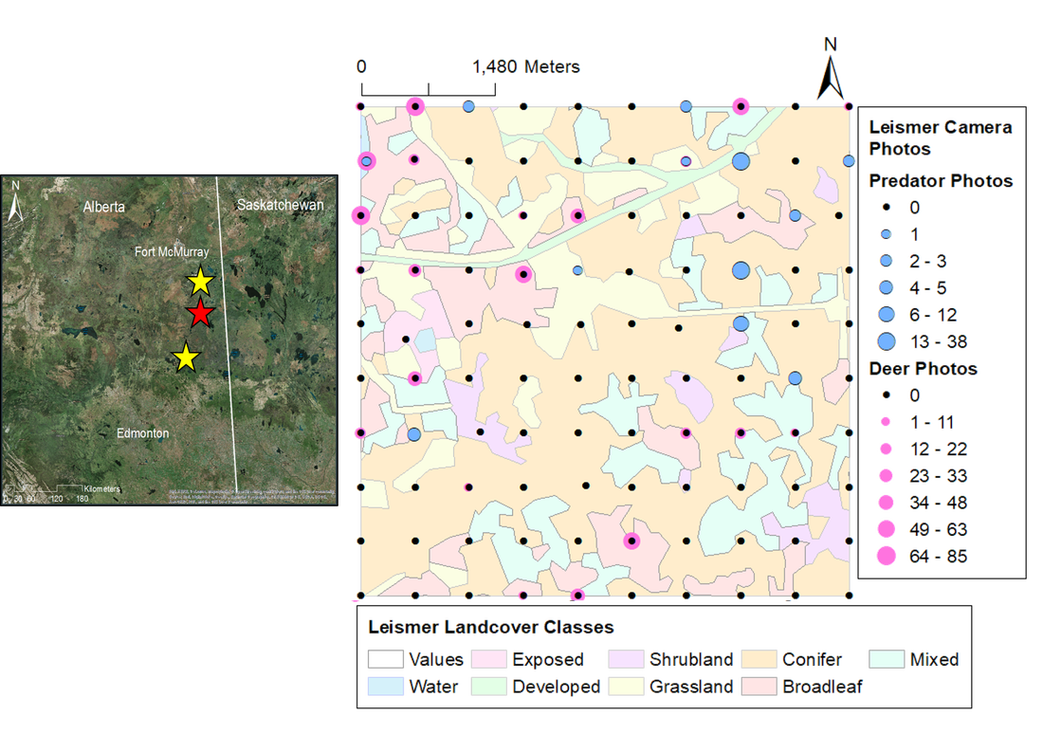
Figure 4. Middle camera grid, located near Conklin, Alberta. Colored polygons represent various landcover types. Blue and pink circles represent the frequency of predator and white-tailed deer photos at each camera station (black circles), respectively.
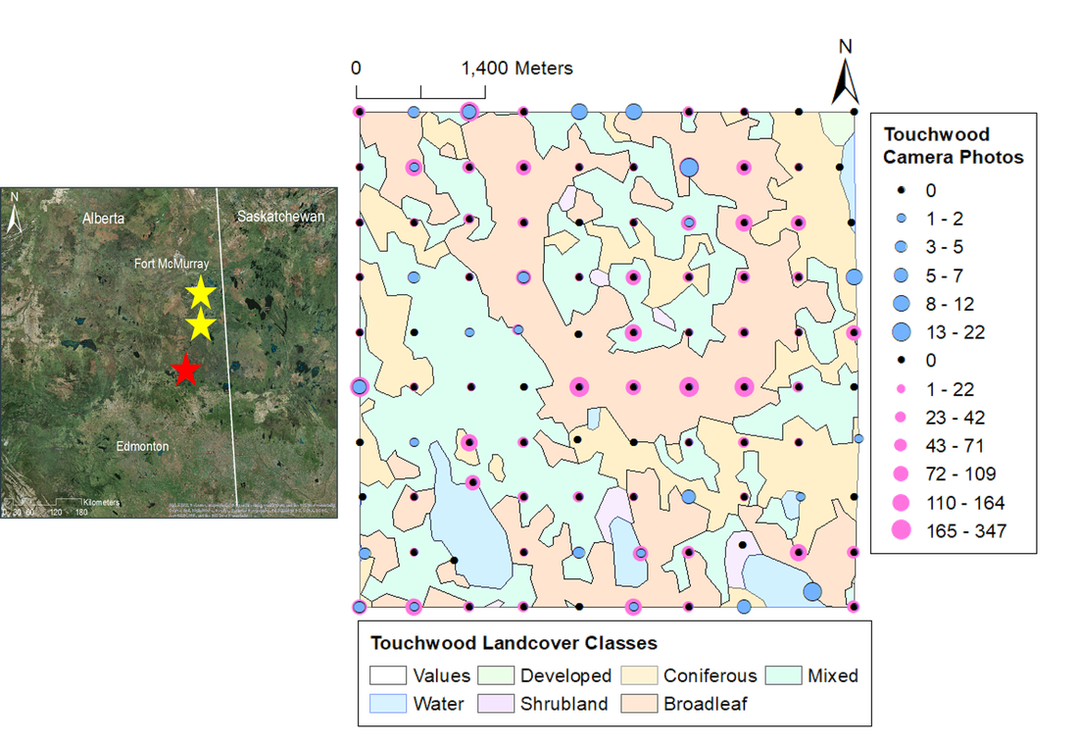
Figure 5. Southern-most camera grid, located near Lac La Biche, Alberta. Colored polygons represent various landcover types. Blue and pink circles represent the frequency of predator and white-tailed deer photos at each camera station (black circles), respectively.
