Summary Tables
Table 1. Summarized statistics for the photos of white-tailed deer across the three study areas. Note that Touchwood has approximately 4000 more photos than Surmont and Nexen, most likely due to the relative lack of human presence at the study site, allowing deer populations to increase relatively uninhibited.
|
Table 2. Summarized statistics for the photos of combined predators (black bears, coyotes, and wolves) across the three study areas. The total number of predator images is much lower across all three study sites compared to deer. This is primarily due to predators occuring in significantly lower densities than their prey across the landscape.
|
Exploratory Graphics
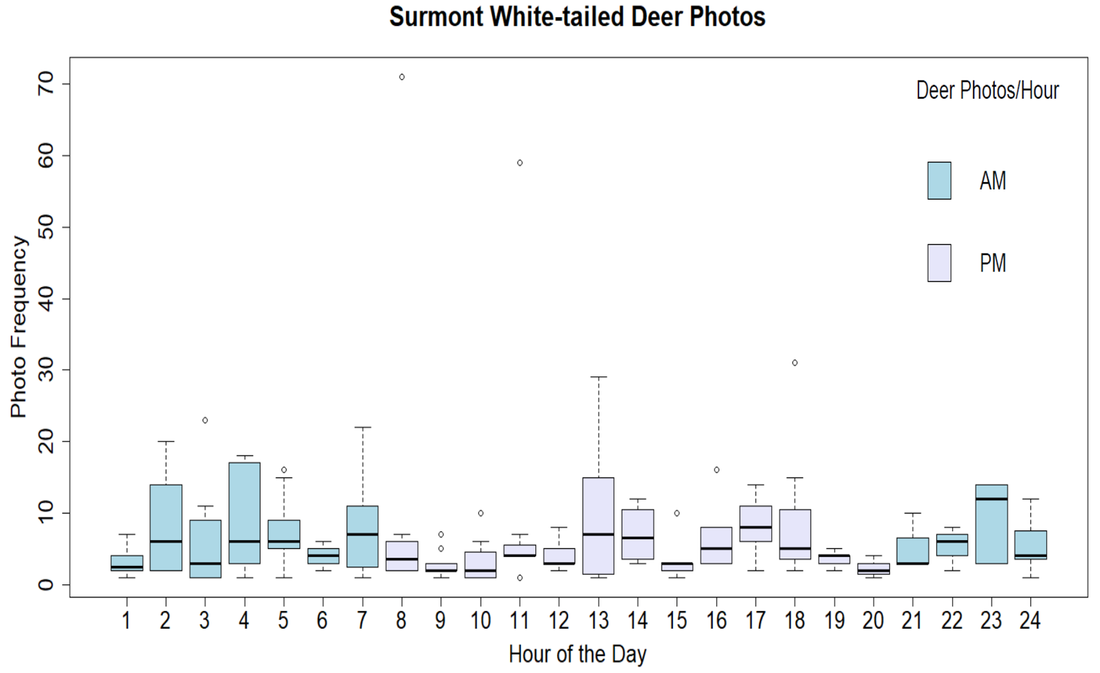
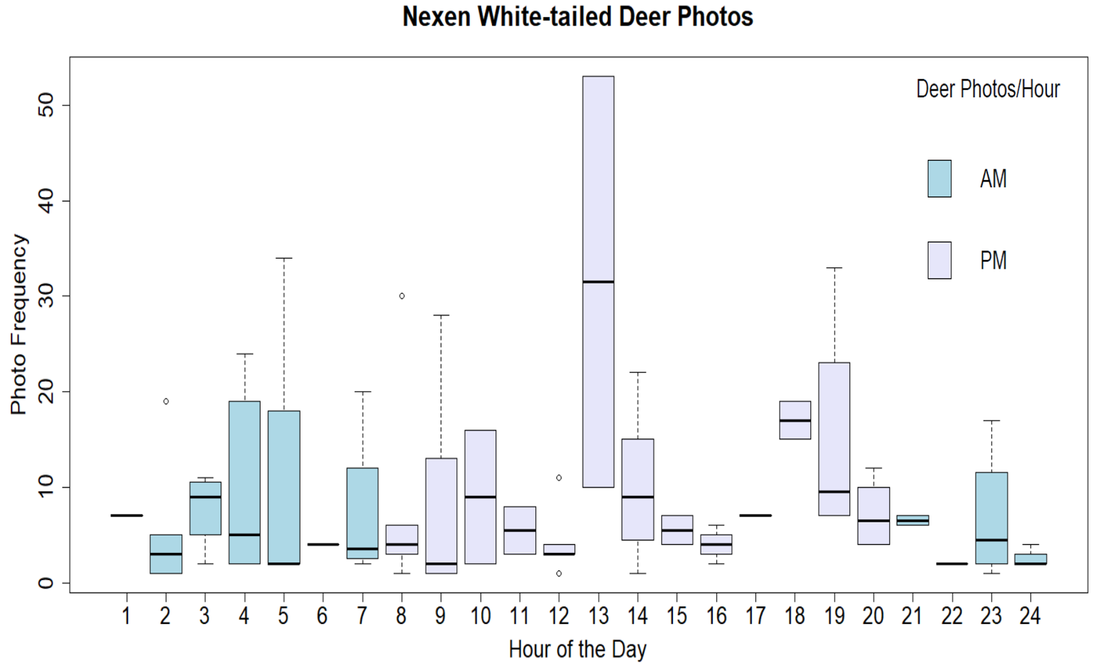
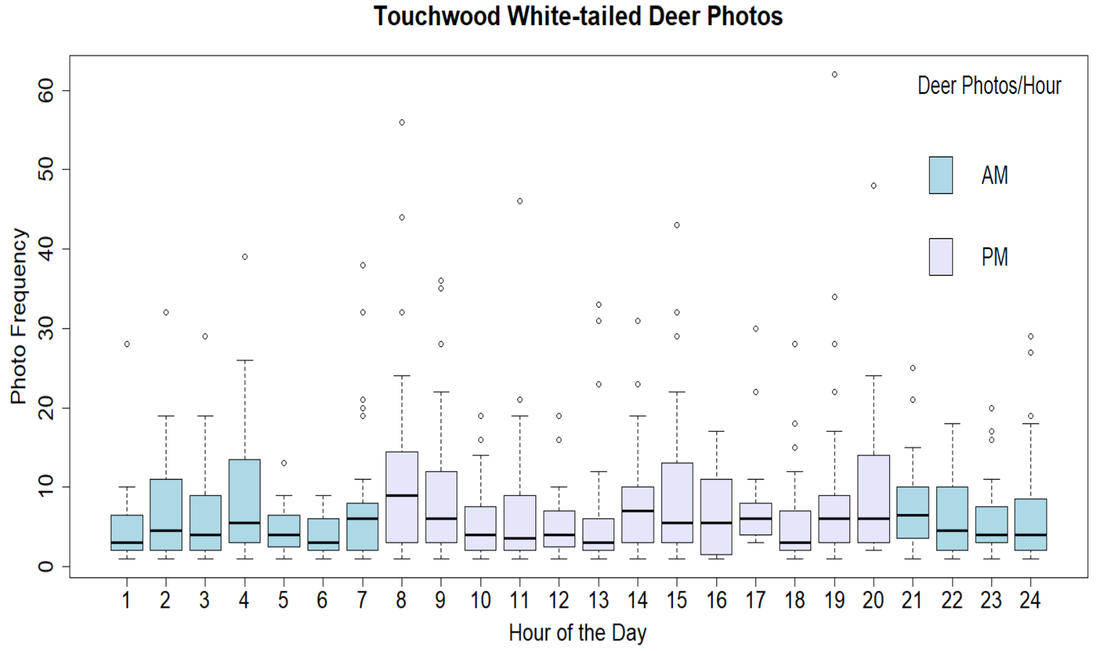
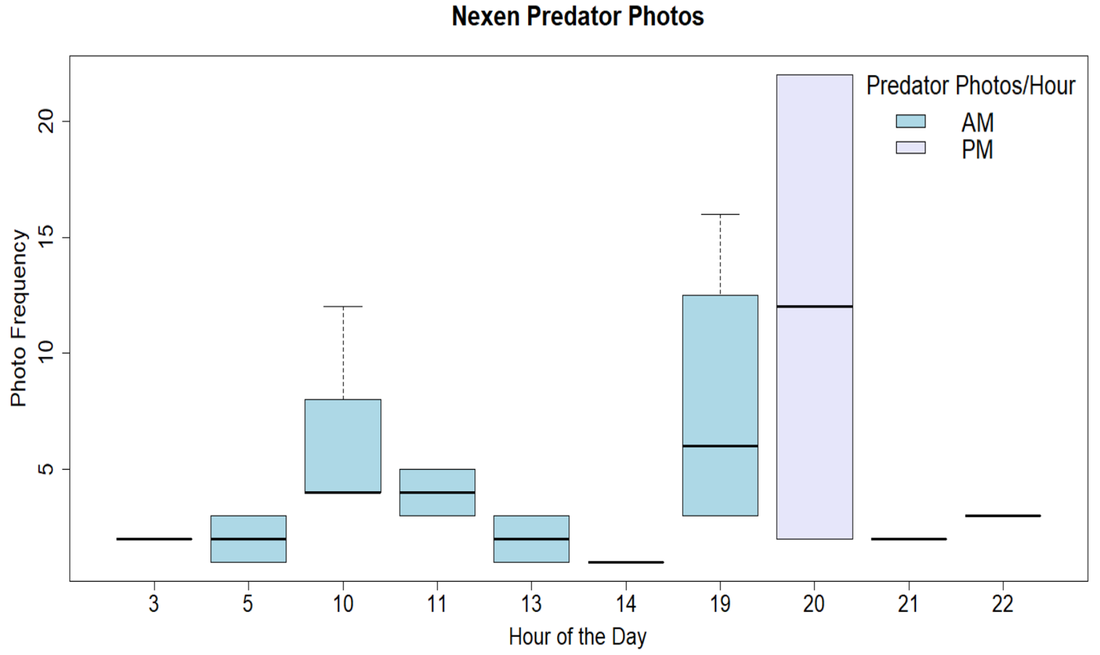
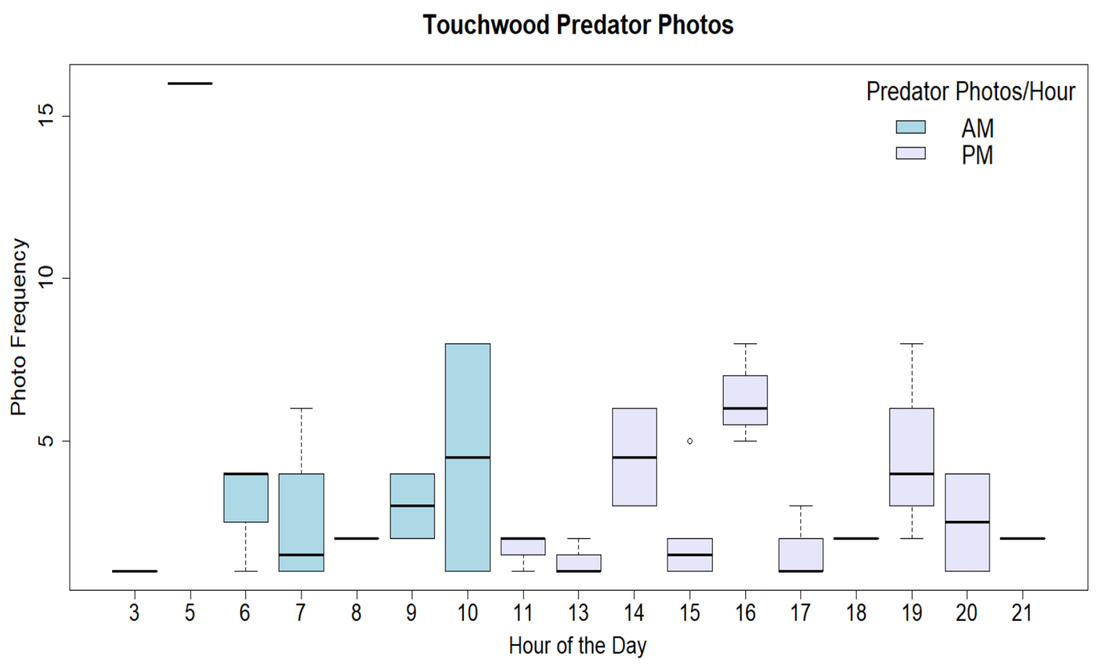
The boxplots below depict the time of day and frequency of photos across each study site for both white-tailed deer and their predators (Figure 6). Across all three grids, white-tailed deer were photographed at least once, every hour of the day between September and October, suggesting a lack of the typical crepuscular behavior observed for this species. The Surmont and Touchwood study sites especially have a large number of outliers, however, I did not remove them from my dataset as they provide valuable information about the frequency and intensity of use of a single camera station. This information would be helpful in establishing the timing of predator-prey overlap at the camera level.
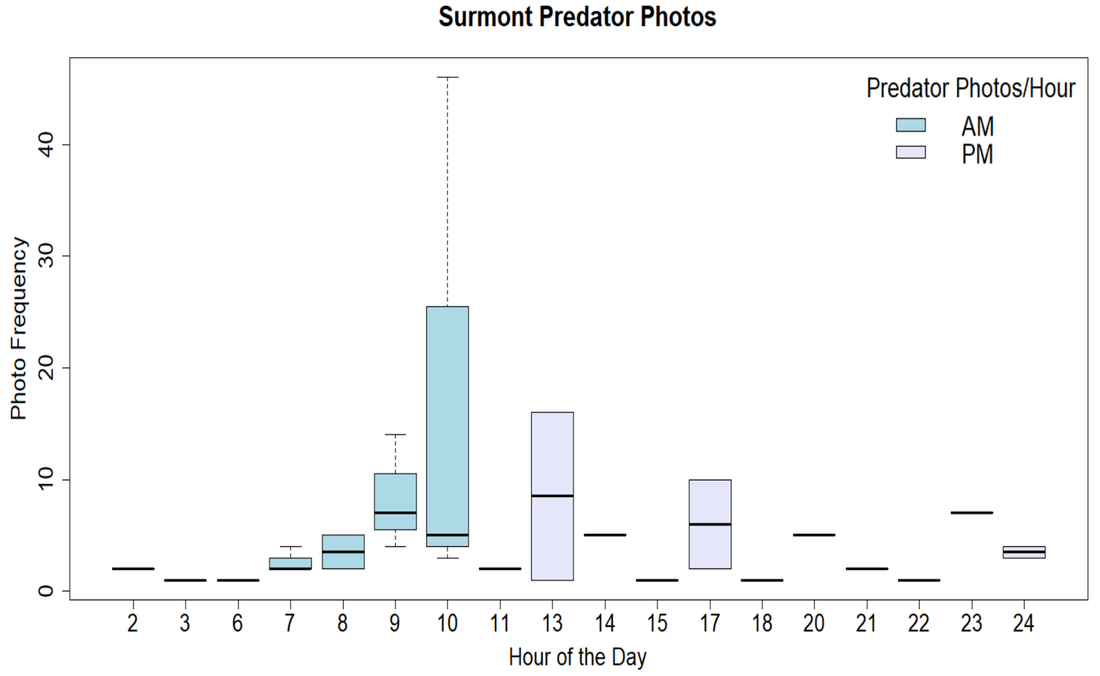
The same boxplots were created for wolves, coyotes, and black bears, but with fewer outliers present and with far greater variation in the timing of the photographs. Specifically, predators were not photographed at every hour of the day, and particularly at the Surmont study site, were often only captured once at any given hour.
The same boxplots were created for wolves, coyotes, and black bears, but with fewer outliers present and with far greater variation in the timing of the photographs. Specifically, predators were not photographed at every hour of the day, and particularly at the Surmont study site, were often only captured once at any given hour.
|
|
|
|
Figure 6. The frequency of predator and prey photos taken on a 24-hour period across all three study sites. Blue boxes represent night photos and lavender boxes represent daytime photos based on the average sunrise and sunset times in Alberta from September - October, 2016.
